How to create a poincare plot
Import everything we might need
[1]:
import xarray as xr
import numpy as np
import xemc3
import matplotlib.pyplot as plt
import tqdm

# Matplotlib setup
import setup_plt
Get some data
Feel free to modify this, to
[2]:
# Use local helper function to get some data
from get_data import load_example_data

ds = load_example_data()
# If you want to use your own data use something like
# ds = xemc3.load.all("path/to/mydata/")
# or if you have converted it already to a netcdf file
# ds = xr.open_dataset("path/to/mydata.nc")
Do the tracing
[3]:
pnc0 = ds.emc3.tracer.poincare_phi0(
    [(x, 0.0) for x in np.linspace(5.556, 5.9191, 20)], 1000
)
Plot it!
[4]:
plt.scatter(pnc0[..., 0], pnc0[..., 1], s=0.1, color="black")
[4]:
<matplotlib.collections.PathCollection at 0x7139087962a0>

Trace to other cross sections
[5]:
phi_indices = np.arange(5) * 9
pncs = ds.emc3.tracer.trace_to_phi_index(pnc0.reshape(-1, 2), phi_indices)
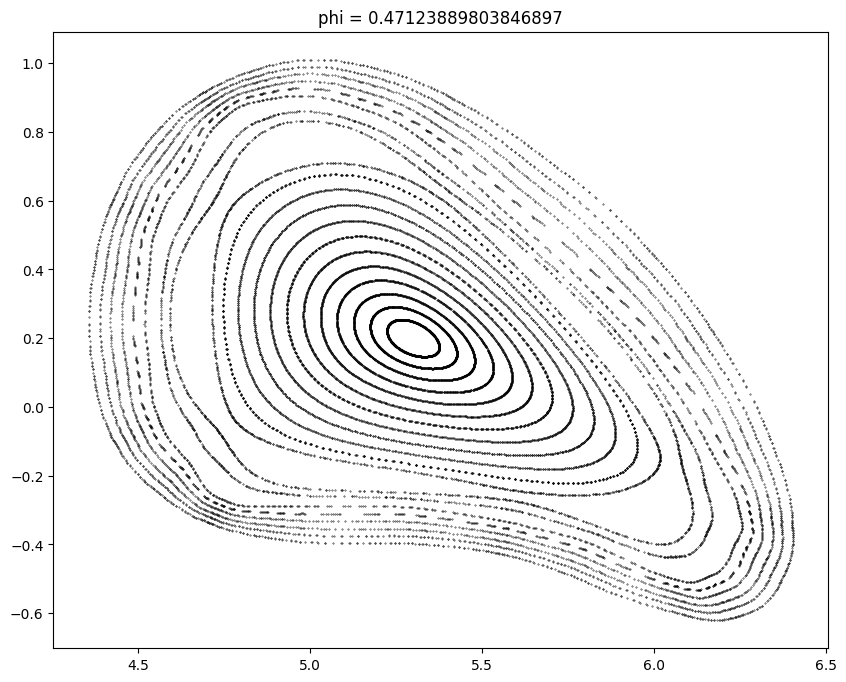
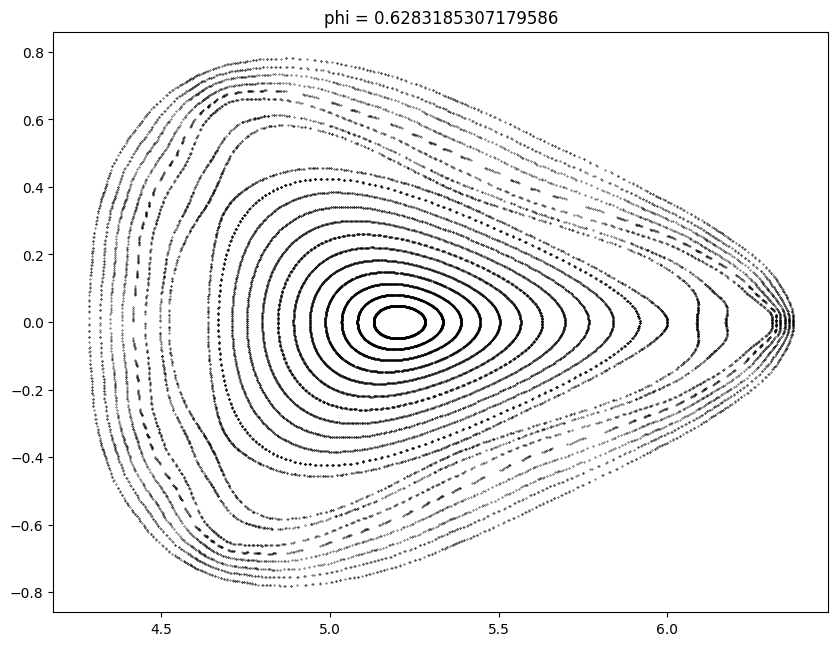
Plot them
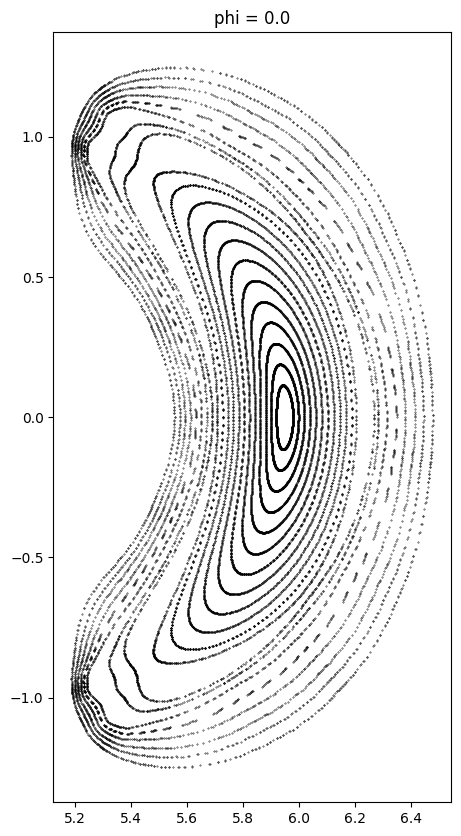
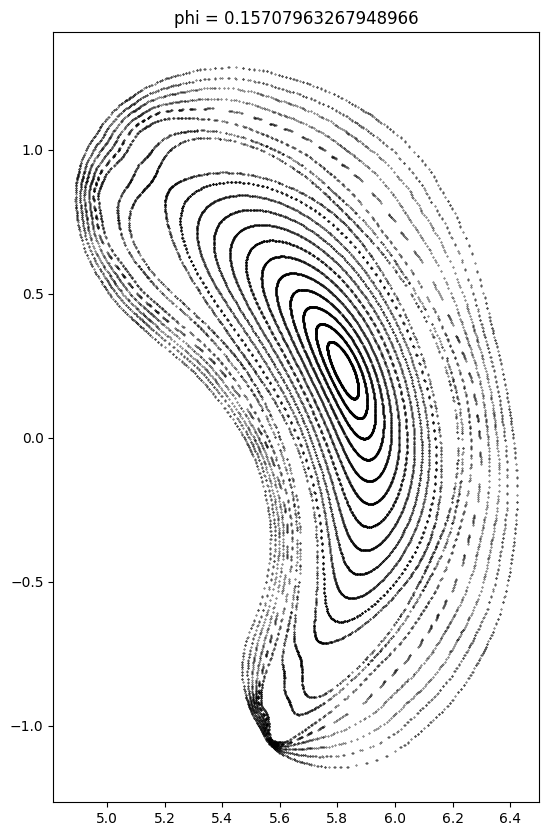
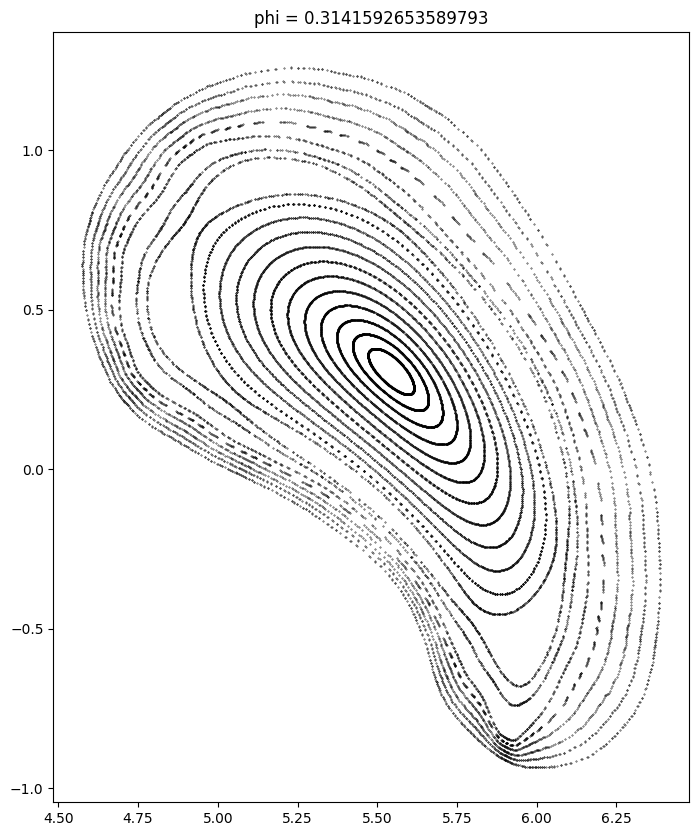
[6]:
phis = ds.emc3["phi_corners"][phi_indices]
for phi, pnc in zip(phis, pncs):
    plt.figure()
    pnc = np.array(pnc).T
    plt.scatter(*pnc, s=0.1, color="black")
    plt.title(f"phi = {phi.values}")
    plt.gca().set_aspect(1)
Find fix points (e.g. x-points)
[7]:
ds.emc3.tracer.fix_point([5.5, 0.8])
[7]:
array([5.4472978 , 0.88279507])
Scan for fix points
[8]:
from xemc3.core.flt_emc_like import FixPointConvergenceError, OutOfDomainError

found = []

for x in tqdm.auto.tqdm(np.linspace(5.5, 6.3, 20)):
    for y in np.linspace(0, 1.2, 40):
        try:
            new = ds.emc3.tracer.fix_point([x, y])
            for old in found:
                if np.sum((old - new) ** 2) < 1e-5:
                    break
            else:
                print(f"Found: {new}")
                found.append(new)
        except (FixPointConvergenceError, OutOfDomainError):
            # Not close to a fix point
            pass
        except IndexError:
            # Not in domain
            pass
Found: [5.51732873 0.60992838]
Found: [5.4472978  0.88279507]
Found: [5.64275443 0.92693019]
[9]:
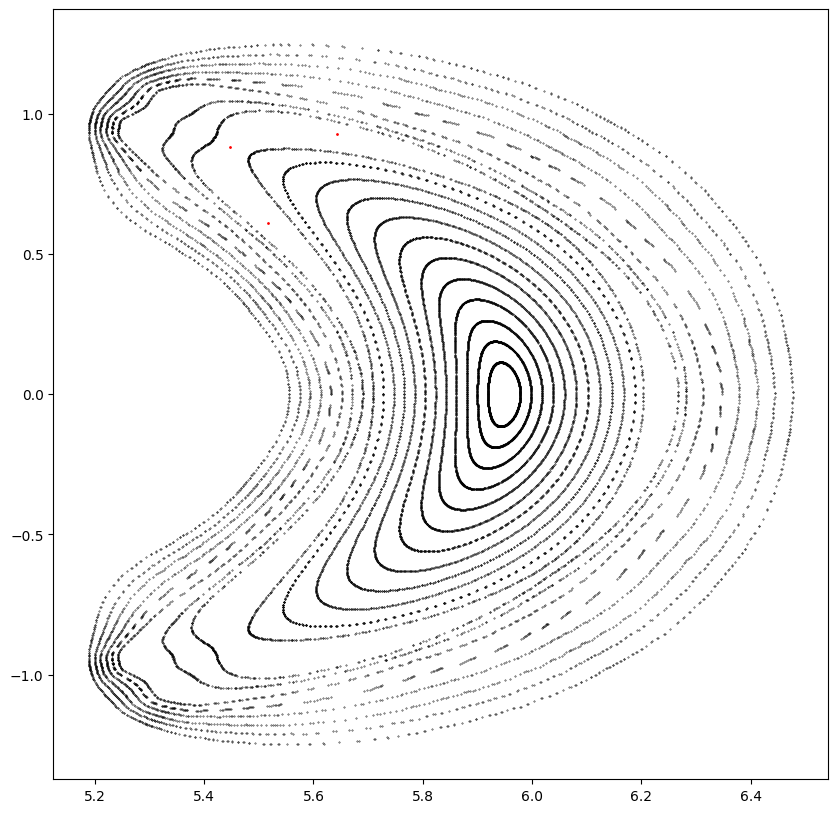
plt.figure()
plt.scatter(pnc0[..., 0], pnc0[..., 1], s=0.1, color="black")
plt.scatter(*np.array(found).T, s=1, color="red")
[9]:
<matplotlib.collections.PathCollection at 0x713908f32c90>